Creating a basic plan
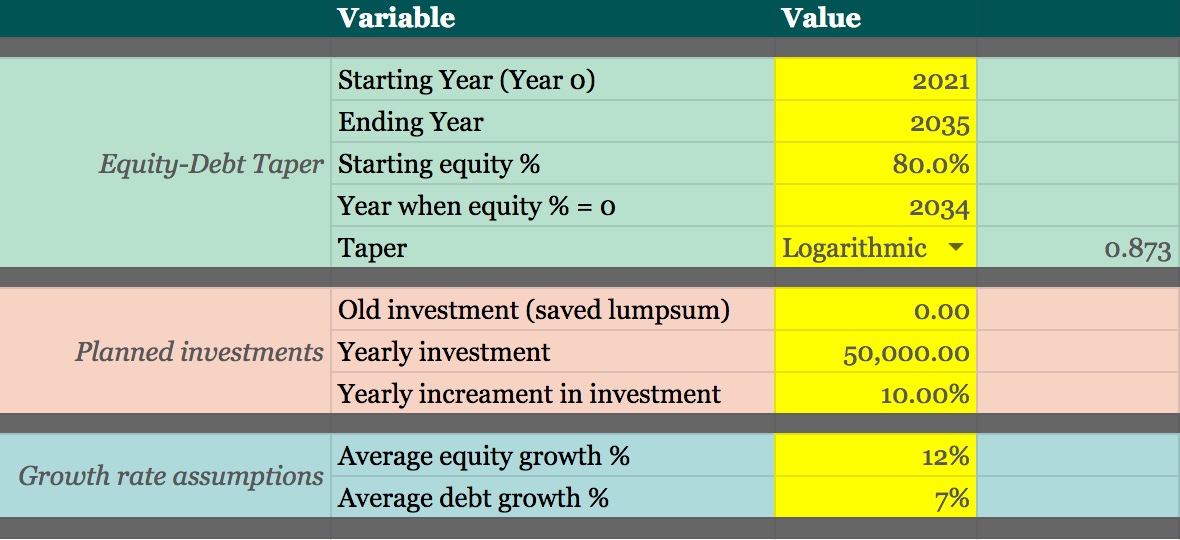
Let us try to understand this with an example. Imagine that you want to save up for some goal that is 15 years away. For the next 15 years, you want to put aside some money and finally liquidate it on the 16th year. Let us say that you would want to start with 50,000 rupees and increase that amount by 10% every year (compounded, i.e. you'll put 10% over 50,000 the second year and 10% over 55,000 the year after) since you are expecting a hike in your salary (or increase in your business) every year.
Let us first study how our spreadsheet might look like—

The first thing (marked by box no. 1 in the spreadsheet) is to plan how your equity and debt exposure would look like over the said period of time. The one in this particular example follows a logarithmic curve. Let us say that you wouldn't want to expose yourself to too much risk and have decided to taper equity exposure to zero by the 14th year.
The second aspect (box no. 2) is the pooling of resources. You would have some corpus at the end of previous year to which you will add the new investment, except if it is the first year and you don't have any pre-saved lumpsum. The idea is to redistribute the corpus into equity and debt instruments at the beginning of year (BoY) in such a way that it is in line with the exposure evolution plan (box no. 3). This might call for liquidating some resource in one asset-class and putting it into another. We will look into the aspect of this redistribution in the next segment.
Finally, you can compute the expected end of year (EoY) corpus with an expected growth rate for equity and debt instruments (box no. 4). For the example above, I have set an equity growth rate of 12% and a debt growth rate of 7%.
At this point, the important thing to understand is that this is merely a plan. The actuals scenario might not like so. You might have surplus money one year to invest but might be in a pinch some other year. Also, the assumed equity and debt growth growth rates are exactly that—assumptions.
You can have a look at the sample spreadsheet here—link.
The entire chart is generated using formulas whose parameters can be fiddled with in the worksheet named "Data".

Please create a copy of the file and play around with the values in yellow cells to see for yourself how the plan in the "Yearly" worksheet changes.
Reality will kick in
The entire discussion in the previous section is about a plan. This means that there would be realities that will subvert your planning and throw curveballs at you. Let us try to follow this with an example. What if you had made this plan in 2004 so that you would have a corpus in 2019. We have historical data to help us out. Let's say that you had invested in an index fund for your equity exposure and a fixed deposit in SBI for your debt exposure.

I have added the yearly rates in the columns so that it is visible in the image. You will have to replace the end of year planned values with the actuals.
There is also the whole act of redistribution that you would have to carry out at the end of each year. This is known as rebalancing. There is something counterintuitive about rebalancing. If one of your asset-class performs well, you will have to neglect it in the next year and instead invest in your poor-performing asset-class. Look at 2005 and 2006. Since equity performed so well in 2005, out of 60,500 rupees planned for 2006, only 1,056 rupees must be invested in equity. Likewise have a look at 2008 and 2009. There was a market crash in 2008 which nearly halved the equity to 69,292 rupees. In 2009, a substantial chunk of the yearly investment—59,508 rupees of 80,526 rupees—must be invested in equity.
This is how the investment and corpus would grow with time—
The point of clairvoyance
No battle was ever won according to plan, but no battle was ever won without one.
—Dwight D. Eisenhower.
You might wonder, "At what point would you know if you will be able to reach your target corpus?" Honestly, there is no set answer to that. Let us look at how the chart would appear midway through this exercise—right at the end of 2010 or the beginning of 2011.

The target value 28,80,416 rupees is not that far off from the actual final corpus of 29,01,175 rupees. That's an error of 0.7%. There are two things that contribute to this. Firstly, in 2011 the debt exposure is greater than 80% and we know that the rate of return wouldn't vary drastically.
Did you know that the you would have gotten the best rate of return for this period if you had chosen linear taper of equity? But honestly, the midway assessment would have yielded only 3% error when compared to the actuals. I leave that exercise to you.
I will tell you why I bring this up. The idea is not to fall into the pits of expectations and greed. If you are able to follow the plan, you will end up somewhere close to where you had intended to be. You can offset that in due course with a slightly larger investment (if you can) when the returns are bad, but even that is not necessary. As long as you have created a goal and have set a 5-10% margin over that target, you would be fine.
The sample spreadsheet gives you an XIRR (internal rate of return computation). Meditate and resist the temptation to maximise that.